-
الإضافة : المبنى 2، رقم 8 طريق هينغزوتانغ 8، دونغقوان
-
الهاتف : الهاتف +86 135 4224 3751

0.2 mm Ultra-thin Graphene Thermal Pad with Thermal Resistance as Low as 0.052 °C·cm²/W
SHEEN GSF110-020 offers a new benchmark for thin-interface thermal management.
For engineers selecting thermal interface materials, the value of a material must be assessed within the context of actual assembly conditions: How large is the interface gap? What clamping pressure does the structure allow? What is the material’s thickness under compression? And given these conditions, what temperature difference is required for heat to transfer across the interface?
The SHEEN GSF110-020 graphene thermal pad achieves new advancements in combining a thin-profile design with low thermal resistance. With a thickness of 0.20 ± 0.03 mm, the product demonstrated an area-normalized thermal resistance of 0.052 °C·cm²/W during testing conducted in accordance with ASTM D5470, under conditions of 50 psi pressure and an average sample temperature of approximately 80°C.
These results offer a new candidate for thermal interface material selection in compact, high-heat-flux electronic devices. Even more valuable is the fact that the test report provides data on thermal resistance, compressed thickness, and compression ratio at various pressures, enabling engineers to correlate material properties with structural design.
Moving from a single performance value to pressure-thickness-thermal resistance data suitable for product selection.
Testing of GSF110-020 was completed by the SHEEN Quality Laboratory on September 24, 2026, using the LW-9389 testing equipment. The initial measured thickness of the specimen was 0.200 mm, and the results at each pressure point are as follows:
| Test Pressure | Area-normalized thermal resistance | Compressed thickness | Compression ratio |
|---|---|---|---|
| 10 psi, approximately 69 kPa | 0.262 °C·cm²/W | 0.197 mm | 1.5% |
| 30 psi, approximately 207 kPa | 0.065 °C·cm²/W | 0.171 mm | 14.5% |
| 50 psi, approximately 345 kPa | 0.052 °C·cm²/W | 0.149 mm | 25.5% |
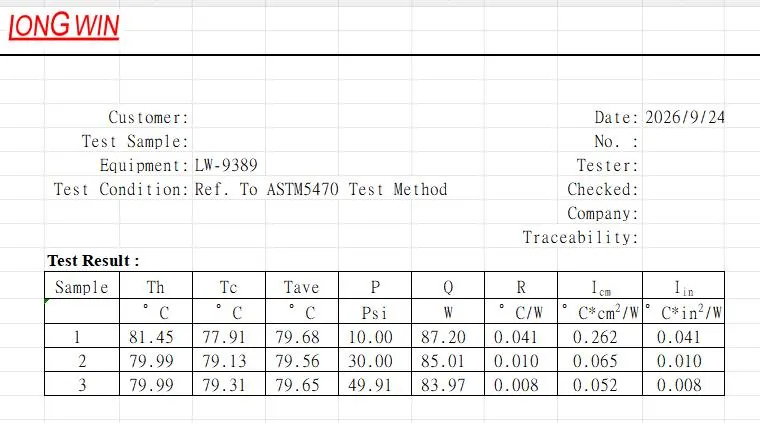
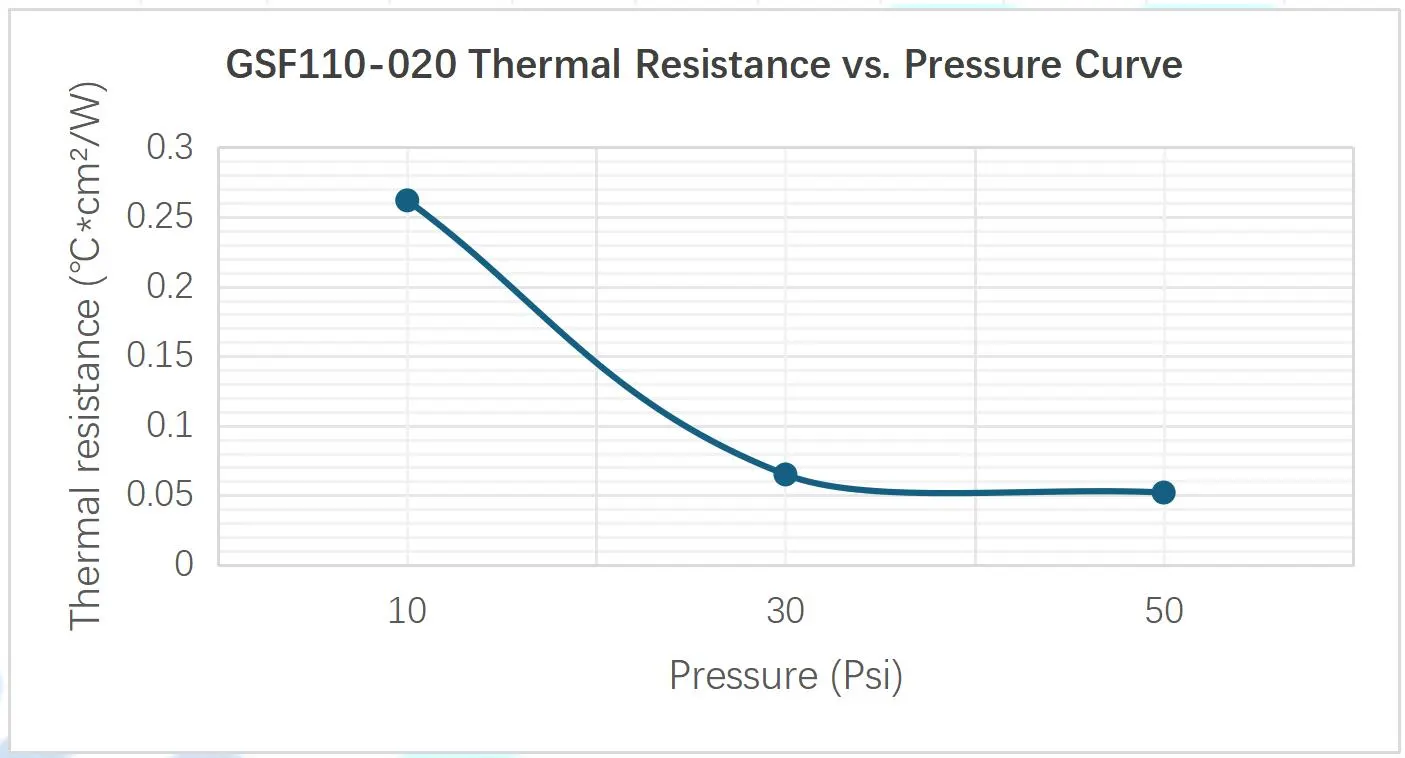
These data indicate that GSF110-020’s thermal performance is closely related to assembly pressure.
Based on the test results, when the pressure increased from 10 psi to 30 psi, the measured thermal resistance decreased by approximately 75.2%, and the thickness decreased from 0.197 mm to 0.171 mm; when the pressure increased from 30 psi to 50 psi, the thermal resistance decreased by a further ~20%, and the thickness decreased to 0.149 mm.
For engineers, this provides a clear design reference: under the test conditions, 30 psi already yields low thermal resistance; increasing to 50 psi can further improve thermal performance, though it also increases structural load and material compression. The actual operating point must be determined by considering the device’s pressure limits, support structure, contact area, and assembly tolerances.
0.2 mm supply thickness; this needs to be considered in conjunction with the actual thickness under compression.
In thin-interface applications, the supplied thickness and the operating thickness affect assembly and operation, respectively.
The initial measured thickness of GSF110-020 is 0.200 mm; it compresses to 0.171 mm at 30 psi and 0.149 mm at 50 psi. This provides a reference for engineers to evaluate an interface thickness of approximately 0.15–0.17 mm under compression.
When selecting a material, factors such as heatsink flatness, package warpage, surface roughness, and dimensional tolerances must be considered simultaneously. The actual interface must ensure sufficient contact for the material to effectively transfer heat. Furthermore, the thickness under pressure reported in test data cannot be directly adopted as the final gap specification for every assembly configuration; product thickness tolerances and actual pressure distribution must also be factored into the design.
For applications involving large gaps or the need to accommodate significant height differences, materials with appropriate thickness and compression characteristics should be selected based on the specific gap-filling requirements.
Engineering significance of low thermal resistance: reducing the temperature difference required for heat to pass through the interface.
The unit °C·cm²/W in the report represents area-normalized thermal resistance. Under simplified conditions of one-dimensional, uniform heat transfer, the temperature difference across the interface can be estimated using the following relationship:
Interface temperature difference ≈ Heat flux density × Area-normalized thermal resistance
If the test result of 0.052 °C·cm²/W can be replicated in actual application:
| Assume a heat flux density. | Estimation of the corresponding interface temperature difference |
|---|---|
| 50 W/cm² | 2.6° |
| 100 W/cm² | 5.2°C |
| 200 W/cm² | 10.4°C |
These calculations demonstrate the significance of low thermal resistance for high-heat-flux interfaces. Reducing the temperature difference across this segment of the thermal path allows engineers to retain greater design margin for device temperature control.
The values above are calculation examples based on tested thermal resistance; actual equipment performance also depends on factors such as hotspot distribution, thermal diffusion, contact conditions, and the performance of the heat dissipation system, all of which require verification through component-level or system-level testing.
Which applications should be prioritized for assessment?
GSF110-020 is worth evaluating for fixed thermal interface applications characterized by narrow gaps and the ability to provide controlled clamping pressure, such as:
| Potential areas for evaluation | Selection Issues of Concern to Engineers |
|---|---|
| Between the AI server GPU/CPU package lid and the cold plate or heatsink. | Is it possible to establish uniform contact under the allowable load and reduce the temperature difference at the interface? |
| Low-profile thermal interface for AI accelerator cards and OAM modules | Does the material working thickness align with the structural tolerances and component heights? |
| Between the data center switch ASIC and the thermal structure | What are the characteristics of pressure distribution and localized hotspots under large-area contact? |
| Fixed thermal interface within high-speed optical modules | Can the required thermal performance be achieved within the limited space and allowable pressure? |
The above outlines suggested areas for evaluation; actual suitability must be confirmed through component-level testing. For high-speed optical modules, assessments should also consider electrical isolation, material cleanliness, and assembly processes; additionally, applications involving repeated mating cycles require further verification regarding friction, wear, and particle generation.
Align material testing with the customer’s actual structures.
Thermal interface material selection engineers can use this report to first determine candidate operating pressures and compressed thicknesses, and then verify thermal performance on actual components.
Particular attention should be paid to the following: if the structure can only provide a contact pressure of approximately 10 psi, the value of 0.262 °C·cm²/W corresponding to that pressure point should be used as the reference for this report, rather than directly applying the minimum value obtained at 50 psi.
For projects slated for mass production, it is also necessary to verify batch-to-batch consistency, as well as performance retention following thermal cycling, high-temperature storage, and prolonged exposure to pressure. Only then can laboratory data be translated into a basis for product design and procurement.
Get the full report and start your interface assessment.
If your project requires a thin thermal interface material with low thermal resistance, please provide the following information to SHEEN Materials:
- Application components, power consumption, and effective contact area;
- Actual interface gap and dimensional tolerances;
- Available clamping force or contact pressure;
- Operating temperature and reliability requirements;
- Electrical isolation requirements and materials currently in use.
Start with the actual assembly conditions to evaluate whether the GSF110-020 meets your thermal management requirements.
Sheen Materials GSF110-020: Features a 0.2 mm thin profile, with thermal interface material selection supported by test data.
To obtain the full test report or inquire about sample evaluation:
WhatsApp / mobile: +86 135 4224 3751
All data in this document is sourced from:
- Sheen Materials internal quality laboratory test report GSF110-020.
- Thermal resistance testing was conducted in accordance with ASTM D5470; the average sample temperature at all three pressure points was approximately 80°C.
- 0.052 °C·cm²/W corresponds to 50 psi; the initial measured thickness was 0.200 mm, and the thickness under pressure was 0.149 mm.
Test results are intended for reference during material selection; actual performance in application depends on assembly and operating conditions.